TL;DR:
- Material-price escalation, inflation, and material shortages are key risk factors driving construction cost overruns. Addressing these involves assigning risk owners, adding reserves, and including escalation clauses tied to price indexes. When reserves run out, financing options can help manage cash flow gaps but do not eliminate underlying risks.
Material-price escalation, inflation, material shortages, design and scope changes, poor quantity/cost estimation, planning and scheduling failures, procurement and payment delays, contract ambiguity, differing site conditions, labor availability and skills gaps, and weather or natural events are the most common cost overrun risk factors. Addressing them requires immediate, targeted action.
Immediate actions to take right now:
- Assign a named risk owner to each of the seven categories above
- Add a contingency reserve for identified risks and a separate management reserve for unidentified variability
- Insert escalation clauses tied to published price indexes (such as the Producer Price Index for construction materials) into active contracts
- Validate major material-price line items directly with suppliers before finalizing the budget
- Open a financing dialogue early if reserves look thin relative to project complexity
The sections below map each risk factor to a specific control, a quantification method, and a governance rule. Where reserves are exhausted and cashflow gaps threaten progress, CR Equity Ai Inc offers construction and bridge financing programs worth reviewing.
Table of Contents
- What are the most common cost overrun risk factors?
- How do you quantify and prioritize cost risks?
- Mitigation strategies mapped to each risk category
- Root-cause patterns that drive repeated overruns
- How to set contingency and management reserves
- When financing becomes part of the solution
- Key Takeaways
- Why the “vital few” framing changes how you manage risk
- Useful sources
- FAQ
What are the most common cost overrun risk factors?
Construction cost overruns cluster into categories including material-price escalation, inflation, material shortages, design and scope changes, poor quantity/cost estimation, planning and scheduling failures, procurement and payment delays, contract ambiguity, differing site conditions, labor availability and skills gaps, and weather or natural events. Understanding which category a risk belongs to tells you who owns it and which control applies first.
| Risk Factor | Typical Trigger | Lifecycle Stage |
|---|---|---|
| Material price escalation | Commodity market swings, supply disruptions | Pre-construction, procurement |
| Inflation | Macroeconomic conditions, interest rate shifts | All stages |
| Material shortages | Supply-chain disruption, single-source dependency | Procurement, construction |
| Design and scope changes | Owner-requested changes, incomplete drawings | Design, early construction |
| Poor quantity/cost estimation | Rushed takeoffs, outdated unit rates | Pre-construction |
| Planning and scheduling failures | Unrealistic durations, resource conflicts | Pre-construction, construction |
| Procurement and payment delays | Slow approvals, contractor cash shortages | Construction |
| Contract ambiguity | Vague scope definitions, missing change-order clauses | Contract execution |
| Differing site conditions | Subsurface surprises, contamination | Construction |
| Labor availability and skills gaps | Tight labor markets, specialty trade shortages | Construction |
| Weather and natural events | Extreme weather, force-majeure events | Construction |
A systematic literature review combined with Delphi and fuzzy-set analysis ranked material-price escalation, inflation, and material shortages among the top factors with “Very High” severity scores. Construction materials represent the majority of direct project cost, so even a moderate price swing on steel, lumber, or concrete can erase a contingency budget that was sized for a calmer market.
Macroeconomic context: Inflation and bond-yield pressures have compounded construction cost risks in US multifamily and commercial projects, making external risk categories harder to hedge through contract language alone.
How do you quantify and prioritize cost risks?
Turn the risk list into budget numbers using this five-step workflow.
- Populate a risk register. Pull every factor from the category table above. Assign an ID, description, category, owner, and current status to each entry.
- Estimate each risk with three-point (PERT) expected value. For each identified risk, collect an optimistic cost impact (O), most likely impact (M), and pessimistic impact (P). Apply the PERT formula: Expected Value = (O + 4M + P) / 6. This smooths outlier estimates and weights the most likely scenario appropriately.
- Apply the R-value approach for reserve sizing. The R-value represents the ratio of reserve to base estimate needed to achieve a target confidence level. Research on residential projects demonstrates that separating contingency (for identified risks) from management reserve (for unidentified variability) measurably improves budget accuracy and precision.
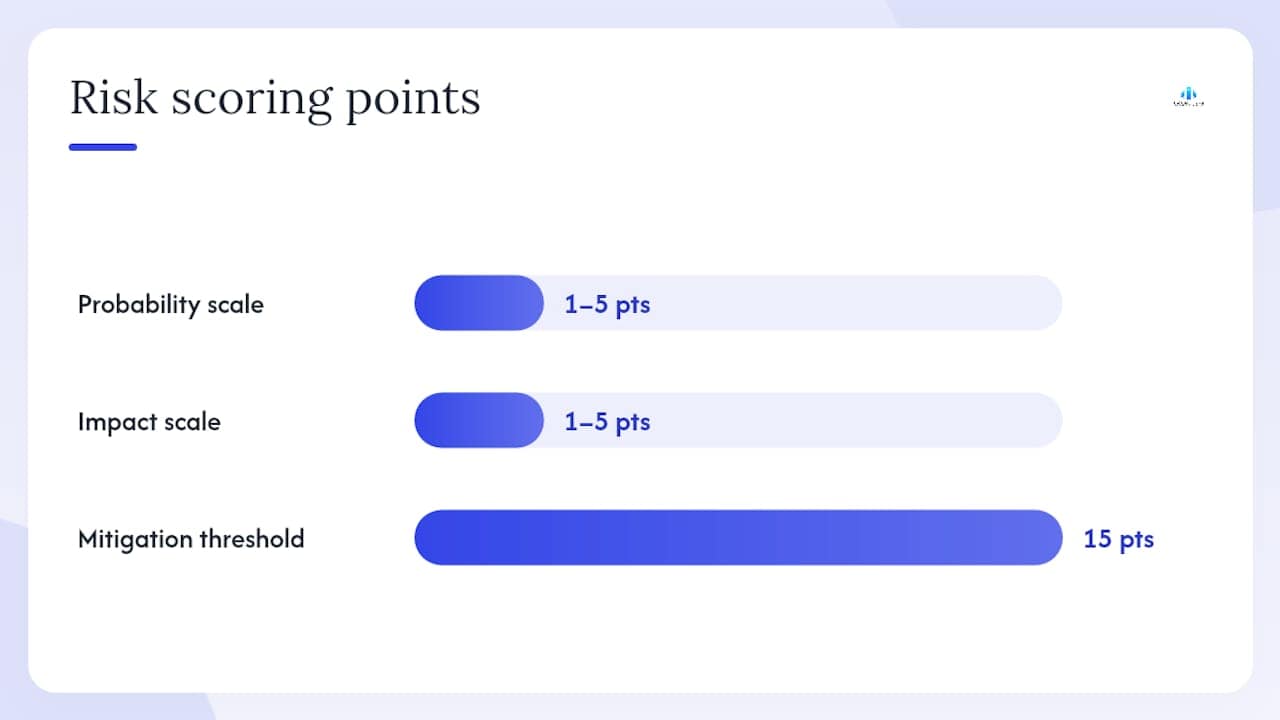
- Score likelihood × impact and rank. Assign each risk a probability (1–5) and an impact score (1–5). Multiply them to get a risk score. Risks scoring 15 or above warrant individual mitigation plans and dedicated reserve line items.
- Set monitoring cadence. Review the top-ranked risks weekly during active construction and monthly during pre-construction. Flag any risk whose expected value increases by more than 10% between reviews as a trigger for reserve release approval.
Deliverables from this workflow: a prioritized risk register, a reserve calculation worksheet showing summed PERT expected values, and a dashboard that tracks reserve consumption against the approved budget.
Pro Tip: Build your risk scoring framework before the design development phase ends. Risks identified after construction documents are issued cost significantly more to mitigate.
Mitigation strategies mapped to each risk category
| Risk Category | Primary Mitigation | Secondary Controls | Typical Owner |
|---|---|---|---|
| External/macroeconomic | Escalation clauses tied to PPI indexes | Commodity hedges, early bulk procurement | Owner/PM |
| Managerial/planning | Integrated master schedule with float buffers | Weekly look-ahead scheduling, resource leveling | Project Manager |
| Technical/design | Constructability review at 60% and 90% design | BIM clash detection, independent cost review | Design Manager |
| Contractual | Clear change-order protocols with approval gates | Dispute resolution clauses, defined scope boundaries | Contract Manager |
| Procurement/supply-chain | Supplier diversification, long-lead procurement plan | Milestone-linked payment terms, backup suppliers | Procurement Lead |
| Site/operational | Geotechnical investigation before bid | Differing-site-conditions clause, weather contingency | Field Superintendent |
Preconstruction diligence and constructability review consistently appear in industry guidance as the highest-return mitigations for design and technical risks. Catching a coordination conflict in a BIM model costs a fraction of resolving it in the field.
- For material-price risk: reference the Bureau of Labor Statistics Producer Price Index in escalation clauses so adjustments are objective and auditable
- For scope creep: require written owner approval before any change order exceeds a defined dollar threshold, and log every verbal instruction
- For procurement delays: identify long-lead items at design development and issue purchase orders before construction documents are finalized
- For payment delays: structure milestone payments to align with verified work-in-place, and include a contractor financial stability review in your prequalification process
Pro Tip: Require a supplier performance clause tied to delivery milestones in every major materials contract. A clause that reduces payment by a defined percentage for late delivery shifts schedule risk back to the supplier and creates a financial incentive for on-time performance.
Strong cost-management practices and transparent stakeholder communication reduce the probability of legal disputes, delayed completion, and project abandonment — outcomes that compound the original budget problem many times over.
Root-cause patterns that drive repeated overruns
Scientometric analysis and Social Network Analysis of 405 published works identified planning and scheduling issues, estimation inaccuracies, design inefficiencies, and contract ambiguity as high-centrality drivers. High centrality means these factors amplify other risks: a scheduling failure, for example, creates downstream procurement delays, which trigger material shortages, which generate change orders.
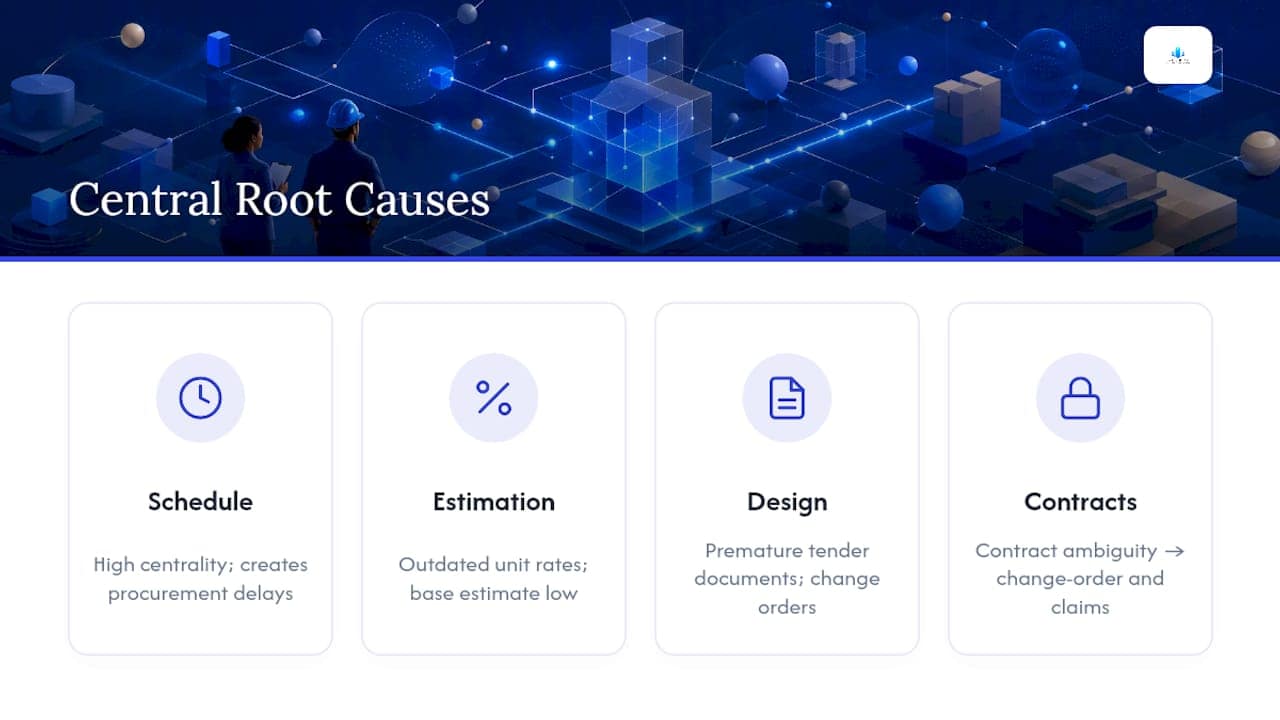
A structured root-cause analysis of construction cost overruns identified 15 universal root causes across a cross-sectional survey of 200 practitioners. Three local drivers stood out: premature tender documents, excessive owner-requested changes, and “suicide tendering” (unrealistically low bids designed to win work, which force contractors into a change-order and claims cycle to recover margin).
Pattern 1: Premature tender documents. An owner issues bid documents before design is complete to accelerate schedule. Bidders price known scope and exclude unknowns. Construction begins, design gaps surface, and change orders accumulate. Final cost exceeds the original contract by a wide margin.
Pattern 2: Estimation cascade. An estimator uses outdated unit rates and skips a quantity takeoff verification. The base estimate is low. Contingency is sized as a fixed percentage of an already-understated number. The first material delivery reveals the gap, and the project never recovers its budget position.
Sketch a simple causal chain for your project: root cause → first-order effect → second-order effect → budget impact. This exercise typically reveals that two or three root causes account for the majority of projected variance.
How to set contingency and management reserves
Contingency reserve covers identified risks with quantified probability and impact. Management reserve covers unidentified variability and is held at a higher approval level. PM World Journal guidance warns against one-size-fits-all percentage rules and recommends sizing both reserves based on project-specific factors.
- Compile all identified risks from the prioritized register
- Calculate the PERT expected value for each risk: (O + 4M + P) / 6
- Sum the expected values across all identified risks to get the contingency reserve floor
- Adjust upward for correlation: risks that tend to occur together (material escalation + procurement delay) are not fully independent, so their combined impact exceeds the sum of individual expected values
- Set management reserve as a multiplier of base cost, scaled by project complexity, duration, and exposure to unidentified risk; longer, more complex projects warrant a higher multiplier
- Document approval thresholds: who can authorize a contingency draw, who controls management reserve releases, and what documentation is required
Governance rules:
- Report reserve consumption monthly to project sponsors, showing both the dollar amount used and the risk event that triggered the draw
- Require a written mitigation update alongside every reserve release request
- Flag management reserve draws immediately to the project owner; these represent risks outside the original risk register and may signal a need to reforecast the total project cost
- Record every draw in the cost control system against the originating risk ID so post-project analysis can improve future estimates
When financing becomes part of the solution
Risk controls and reserves are the primary defense against budget overruns. Financing is an adjunct, not a substitute, and it carries its own cost that must be weighed against alternatives.
When reserves are exhausted or payment delays create a cashflow gap that threatens construction progress, CR Equity Ai Inc offers programs structured for exactly these situations:
- Ground-up construction loans with milestone draws on CR Equity Ai Inc’s own capital, designed for projects where draw timing and lender responsiveness directly affect schedule
- Fix-and-flip financing for renovation projects facing cost timing gaps

Use the quick quote tool to estimate loan parameters before committing. Analyze the all-in cost of financing against the cost of a project delay or a forced change-order settlement. Financing resolves a cashflow problem; it does not reduce the underlying risk.
This article provides general information only, not financial or legal advice. Confirm current terms and program availability with CR Equity Ai Inc or a qualified financial professional before drawing funds.
Key Takeaways
Planning and scheduling failures, inaccurate estimates, and material-price escalation are the highest-centrality cost overrun risk factors, and addressing them first yields multiplier benefits across the entire risk register.
| Point | Details |
|---|---|
| Assign risk owners immediately | Each of the main risk categories needs a named owner before construction begins. |
| Separate contingency from management reserve | Contingency covers identified risks; management reserve covers unidentified variability — sizing them separately improves budget accuracy. |
| Use PERT expected value | Calculate (O + 4M + P) / 6 for each risk and sum results to set the contingency floor. |
| Insert escalation clauses | Tie material-price adjustments to the Bureau of Labor Statistics PPI to keep adjustments objective. |
| Govern reserve releases formally | Require written documentation for every draw and report consumption monthly to project sponsors. |
Why the “vital few” framing changes how you manage risk
Most risk registers I review contain 40 or 50 line items. That length creates a false sense of thoroughness while burying the risks that actually matter. SNA research is unambiguous: planning and scheduling failures and estimation inaccuracies have network effects that amplify nearly every other risk on the list. Fix those two, and you reduce the probability and severity of a dozen downstream problems simultaneously.
The governance point that gets overlooked most often is reserve transparency. Publishing reserve consumption monthly, alongside the specific risk event that triggered each draw, does two things: it keeps sponsors informed before surprises become crises, and it builds the institutional data needed to size reserves more accurately on the next project. Numbers without context are just noise. Mitigation status alongside the numbers is what enables a sponsor to make a decision.
Useful sources
- Root-Cause Analysis of Construction-Cost Overruns
- Improving Project Budget Estimation Accuracy and Precision by Analyzing Reserves for Both Identified and Unidentified Risks
- Information (MDPI) — systematic literature review + Delphi + fuzzy-set analysis on cost risk factors
- 6 Causes of Construction Cost Overruns & How to Prevent Them (Autodesk blog)
- Mitigating Cost Overruns in Construction | Procore
FAQ
What are the most common causes of construction cost overruns?
Material-price escalation, inflation, material shortages, design and scope changes, poor quantity/cost estimation, planning and scheduling failures, procurement and payment delays, contract ambiguity, differing site conditions, labor availability and skills gaps, and weather or natural events are consistently ranked as the most frequent causes across systematic literature reviews and industry studies.
What is the difference between contingency reserve and management reserve?
Contingency reserve covers identified risks with quantified probability and impact; management reserve covers unidentified variability and is held at a higher approval level, typically controlled by the project owner rather than the project manager.
How do you calculate contingency reserve using three-point estimation?
Apply the PERT formula, Expected Value = (O + 4M + P) / 6, to each identified risk, then sum the results across all risks to establish the contingency reserve floor, adjusting upward for correlated risks.
How does scope creep lead to budget overruns?
Uncontrolled scope changes add work that was not priced in the original estimate; without a formal change-order approval process, these additions accumulate and erode both contingency and management reserves before the project team recognizes the full exposure.
When should a project manager consider financing to address cost overruns?
Financing is appropriate when reserves are exhausted and a cashflow gap threatens construction progress, but it carries its own cost; compare the all-in financing cost against the cost of a project delay before drawing funds.